Scoring and prediction
You can read every number back to what produced it.
A lead score here is five factors — profile completeness, engagement, company fit, behavioural signals and recency — each capped, each returning its own detail, adding to a hundred and landing in a grade band. Churn risk works the same way across account health, ticket volume and the rest, and every factor reports its own contribution and its own ceiling. The forecast is a regression over your own history. None of it is a model being asked what it thinks, which is why an answer can be argued with.
How it works
What is being computed
Four separate things, all of them showing their working.
Scores, with their factors
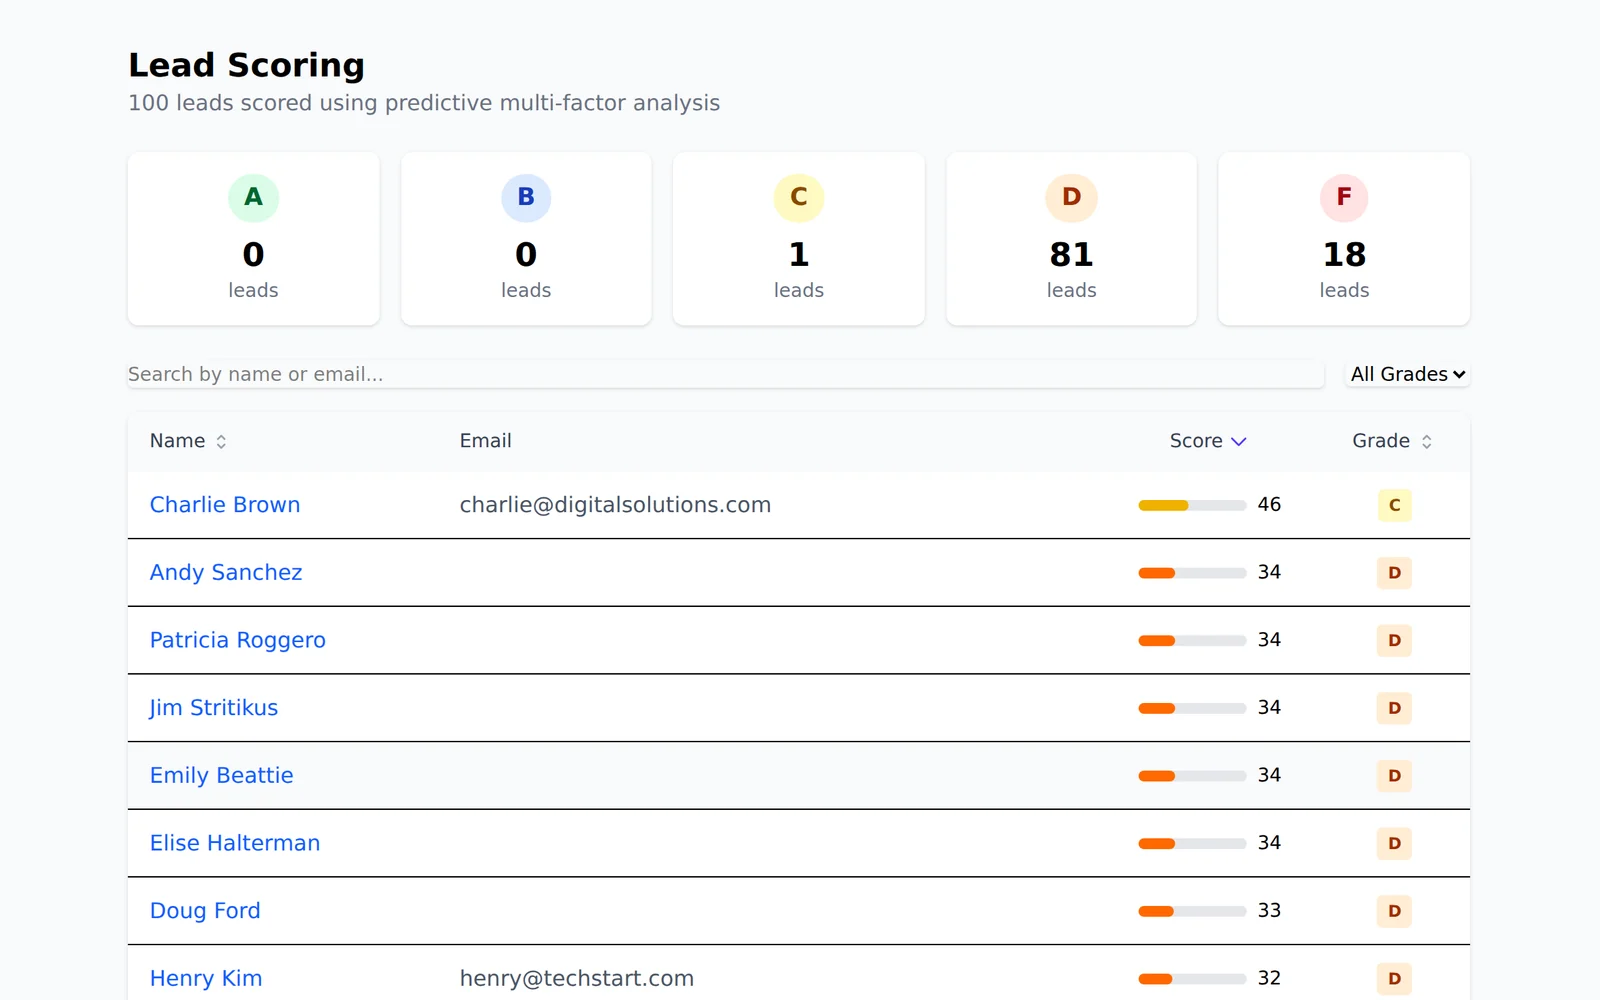
A contact scores out of a hundred and carries a grade, and the response holds the breakdown: what each factor contributed and what it could have contributed. A rep who disagrees with a score can see which part they disagree with, which is the difference between a ranking and an instruction.
Risk, as weighted evidence
Churn risk assembles factors with their own maximums — the account’s latest health score, recent support volume and the rest — and each one states its own reasoning in a line you can read. Where a factor has no data, it says so rather than scoring it as good news.
Anomalies and a forecast
Pipeline anomalies are detected against your own history, and a thirty-day projection is a regression over the same series — contact growth, revenue, ticket volume and win rate. It is a straight-line projection of what has been happening, not a promise about what will.
In the product
A score, and the five things that made it.
Who it is for
For anyone who has to defend a priority order
Scoring is easy to ship and hard to trust. These are built to be inspected by the person whose day gets reordered by them.
- A BDR who wants to know why one lead ranks above another before working it that way.
- A sales manager who needs a ranking they can explain in a pipeline review.
- A customer success lead watching for accounts that are quietly going wrong.
- An operations lead who has been asked for a forecast and would like to say how it was produced.
Related
Questions
The things people actually ask.
Is the lead score produced by a model?
No. It is arithmetic over your own records, which is why the breakdown can be shown and why the same contact scores the same twice. That is a deliberately unfashionable answer and a much more useful one.
Can I see why a contact scored what it did?
Yes. Each of the five factors returns its own score, its own maximum and its own detail, and the result carries a recommendation derived from the same figures rather than from a separate opinion.
How far ahead does the forecast look?
Thirty days by default, across contact growth, deal revenue, ticket volume and win rate. It is a projection of your own trend line, and it should be read as one.
What happens when there is not enough history?
The product’s standing rule applies: not measurable is reported as not measurable, never as zero. A thin series does not get quietly rounded into a confident number.
Does scoring change my data?
Scoring a contact stores the score, the grade and the time it was taken, so a score can be read as of when it was computed. Nothing else about the record is touched.
Score a list and read the factors.
If the breakdown does not convince you, the score should not either.